
The first day, I introduced to students the we will be doing our experiment around gummy bears. Their homework the first night was to do some background research on gummy bears. I provided them with links and also useful search terms. The next day we came back and shared what we found out. We recorded any vocabulary in the vocabulary graphic organizer. Any background research we found we also recorded.
Forming a Question and Hypothesis
Vocabulary: Write a definition and draw pictures for vocabulary
|
- Background Information- List what you know about
the topic:
|
Once we established what we know, I introduced the idea of variables. I asked groups to work together to brainstorm something we could change to test these gummy bears. Students came up with the idea of placing gummy bears in various liquids and then testing to see which liquid makes the gummy bears grow the most. We established our question, materials, and hypothesis.
- Inquiry Question-
(How will changing_______ affect______?)
What liquid will make a gummy bear grow the most?
|
- Hypothesis-
(I predict___________ because__________.)
I predict that water will make the gummy bear grow the most because there is no sugar or salt to block up the small holes in the gummy bear and not allow water to enter the gummy bear through osmosis.
|
- Materials
|
The next day, with materials in hand we measured our initial lengths and weights. Because we are looking for the most growth, we would test the change in weight and length, which means we would subtract the initial weight and length from the final weight and length. So the first day we did just that, we measured and then wrote out procedure for the day.
- Procedure
|
The following day, after allowing the gummy bears to soak for 24 hours, we pulled them out and measured our after soaking measurements. We also created a table and recorded our results in said table.

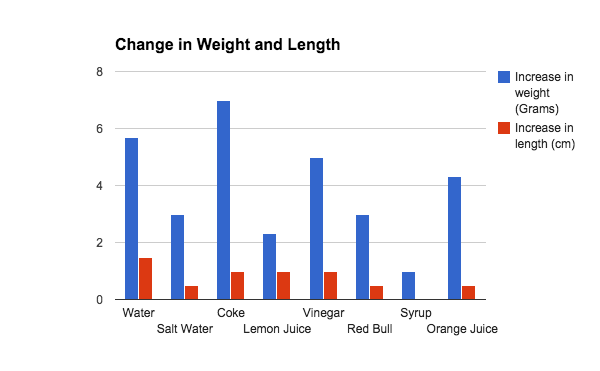
The next thing I did is show students how to make a bar graph of the results in Google Spreadsheet. All you need to do is create a small table with just the results you want o graph. In this case, it would be just the liquids and the amount of weight it grew and the amount of length it grew.

Then you highlight all of these rows and columns and then go to "insert"-----"chart". Then you can modify it from there. I selected a column bar graph. I changed the title and anything else I needed.
Finally after we have all our results graphed and organized, we can draw some conclusions from our data.
Data Analyzing and Interpreting Results
|
- Was your hypothesis supported? Tell how you
know.
Our hypothesis was partially supported. Water did make the gummy bear grow the most in terms of length, however, coke made the gummy bears grow the most in terms of weight. I know this because water had an increase in length of 1.46 cm. The next highest increase in length was coke, lemon juice, and vinegar with a 1 cm increase. Coke had an increase in weight of 7 grams while water only increased the weight by 5.67 grams.
|
- Results- Share observations supported with data
and vocabulary.
The solution that caused the Gummis to grow the most was water and coke.. The coke Gummi grew from 2 g to 9 g. The length increased of water was from 2.07 cm to 3.53 cm.. The solution that caused the least growth was the syrup. It grew from 2 g to 3 g. The length actually shrunk. The initial length was 1.96 cm and the final length was 1.6 cm.
|
- Conclusion- Tell what your experiment proved
Based on our results we think water and coke worked the best for two reasons. First, because we let the solution sit for 24 hours and the water solution didn’t break down the gummy bear like many more acidic liquids.. Secondly, perhaps the carbonation in the coke allowed for more coke to be absorbed into the gummy bear.
|
- Application- What is another experiment you
could do on this topic?
Another experiment we could do is try other liquids. Maybe categorize them into acidic and non-acidic. We could also leave the gummy bears soaking for more or less time.
|
No comments:
Post a Comment